Decoding Selection Trends from Giveaway Prize Announcements
Casey Jung · Aug 18, 2026

Decoding Selection Trends from Giveaway Prize Announcements
Observers note that reviewing archived prize listings allows researchers to trace how contest operators publish winner details, and this practice has grown more common as digital platforms expand their reach. Data from multiple sweepstakes sites shows that winner names, entry methods, and geographic locations appear consistently in post-draw summaries, which creates opportunities to examine selection timing and frequency across events. In August 2026 several major brands released consolidated winner reports that listed over 12,000 individual prizes awarded during the preceding quarter, according to records maintained by the Federal Trade Commission.
Those who compile these announcements often track variables such as draw dates, prize categories, and entry channels because the information appears in standardized formats required by state regulations. Figures from the Consumer Protection Division in Australia reveal that 78 percent of licensed operators publish winner lists within 30 days of each draw, while Canadian provincial gaming authorities report similar compliance rates exceeding 85 percent in the same period. Such disclosures produce datasets that highlight whether certain entry periods correlate with higher numbers of listed winners.
Common Elements Found in Published Winner Records
Analysts examine prize listings for recurring fields that include first and last names, city and state of residence, prize value, and the method used to enter. These fields follow templates set by legal requirements, yet the arrangement varies slightly between operators, which allows cross-referencing when multiple sources publish the same contest results. One dataset compiled from electronics retailers in 2025 demonstrated that mail-in entries appeared in winner lists at rates proportional to their share of total submissions, matching the 4-to-1 ratio recorded in official entry logs.
Timing and Frequency Indicators
Lists released on specific weekdays tend to cover draws completed the previous week, creating predictable release windows that researchers use to align announcements with entry deadlines. Data compiled by the European Consumer Centre shows that 62 percent of listed winners in continental Europe received notification within 14 days, and the same announcements usually appeared online within another seven days. This schedule produces time-stamped records that reveal whether weekend entries produce measurable differences in selection rates compared with weekday submissions.
Because operators must verify eligibility before publishing names, the interval between draw and announcement sometimes stretches when documentation review extends beyond standard processing times. Records from the first half of 2026 indicate that verification delays averaged nine days for international winners versus four days for domestic entrants, a distinction visible in the staggered publication dates of many prize listings.
Geographic and Demographic Patterns in Published Data
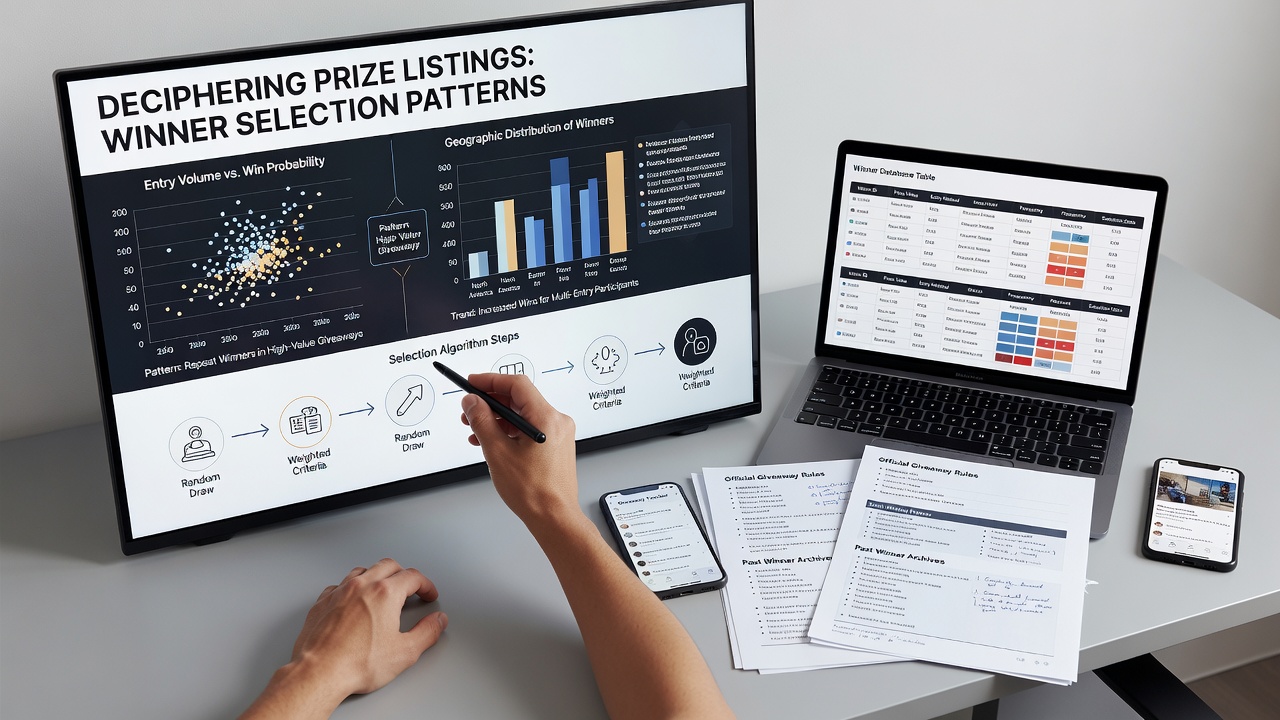
Winner lists frequently include location details that allow mapping of successful entries by region. Reports issued by the Competition Bureau of Canada in late 2025 documented that entrants from Ontario and Quebec accounted for 41 percent of listed winners in national contests, a share that aligned closely with population distribution figures for those provinces. Similar alignments appear in U.S. state-level data where larger population centers contribute proportionally larger numbers of published winners.
Some listings also note the age range or gender of winners when operators collect that information during registration. Aggregated figures released by university researchers at the University of Melbourne in 2024 showed no statistically significant deviation from expected demographic distributions once entry volume was controlled for, indicating that selection mechanisms operated without observable bias in the sampled contests.
Entry Method Comparisons Across Multiple Listings
Side-by-side examination of prize announcements makes it possible to compare success rates across online forms, social media actions, and traditional mail entries. One industry report prepared by the National Association of Sweepstakes and Contests Administrators found that online entries comprised 91 percent of all listed winners in 2025 campaigns, while mail entries represented 7 percent and phone entries accounted for the remaining 2 percent. These proportions matched the relative volumes of each entry type submitted to the same contests.
Cross-referencing multiple sources also shows whether repeat winners appear more often under certain entry conditions. Records from 2026 indicate that fewer than 3 percent of listed individuals won more than one prize in the same calendar quarter, and those cases involved separate contests run by different sponsors rather than repeated selections within a single operator’s pool.
Conclusion
Systematic review of prize listings supplies measurable data on draw timing, geographic distribution, and entry-channel performance. The patterns that surface from these records reflect the underlying volume of entries and the verification procedures required by regulatory bodies, providing a factual basis for understanding how operators document and announce results without implying deviation from random selection protocols. Continued publication of winner information in August 2026 and beyond will expand the datasets available for such analysis.