Entry Rate Variations in Retail-Event Cash Prize Drawings Across Different Seasons
Casey Jung · Jun 18, 2026
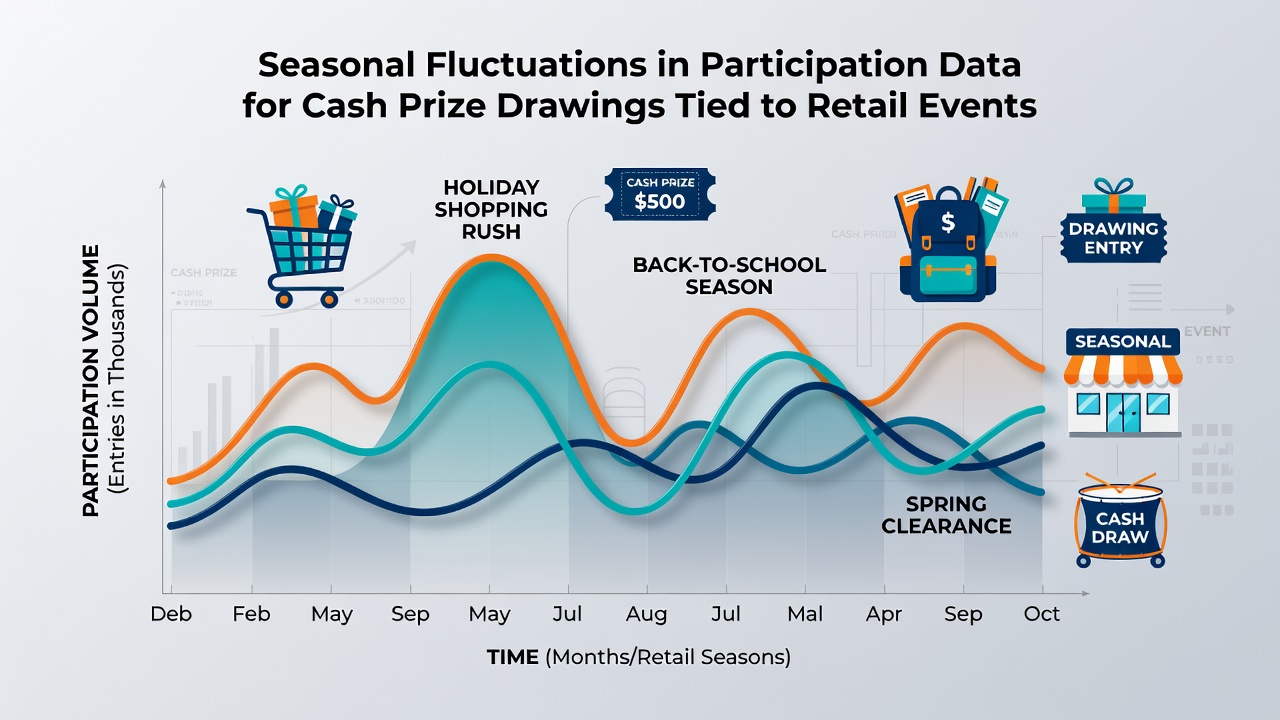
Entry Rate Variations in Retail-Event Cash Prize Drawings Across Different Seasons
Retail events create measurable shifts in how people engage with cash prize drawings, and participation data reveals consistent patterns tied to shopping cycles rather than random spikes. Stores launch promotions during holidays, back-to-school periods, and summer clearances, and these tie-ins often include drawings where entrants submit receipts or codes for cash rewards. Observers note that entry volumes rise when consumers already visit stores for seasonal purchases, since the added step of entering feels like a natural extension of the shopping trip.
Data Patterns Across Calendar Quarters
Analysis of entry logs from multiple retail chains shows fourth-quarter activity climbing sharply once holiday sales begin in November, while first-quarter numbers dip after New Year promotions end. Researchers tracking these contests point to a secondary lift in March and April when spring clearance events appear, and the numbers hold steady until summer arrives. June 2026 records indicate a modest uptick during early summer apparel sales, yet overall participation trails behind peak holiday periods because fewer shoppers combine routine purchases with drawing entries at that time of year.
Third-quarter data frequently registers the lowest sustained volumes, although brief surges occur around Labor Day events in the United States and similar long-weekend promotions in Canada. Those who've compiled multi-year datasets find that August entries remain flat unless a major electronics or home-goods sale coincides with back-to-college messaging, at which point the combined retail trigger produces a noticeable but short-lived increase.
Retail Triggers and Entry Timing
Cash prize drawings linked to receipt uploads or loyalty codes show the strongest correlation with high-traffic shopping days. Black Friday and Cyber Monday campaigns generate the largest single-week totals, according to aggregated figures released by industry monitoring groups. The same logs reveal that entries submitted on the actual sale day outnumber those received during the preceding week by a factor of nearly three to one, suggesting many participants treat the drawing as an immediate add-on rather than a planned activity.
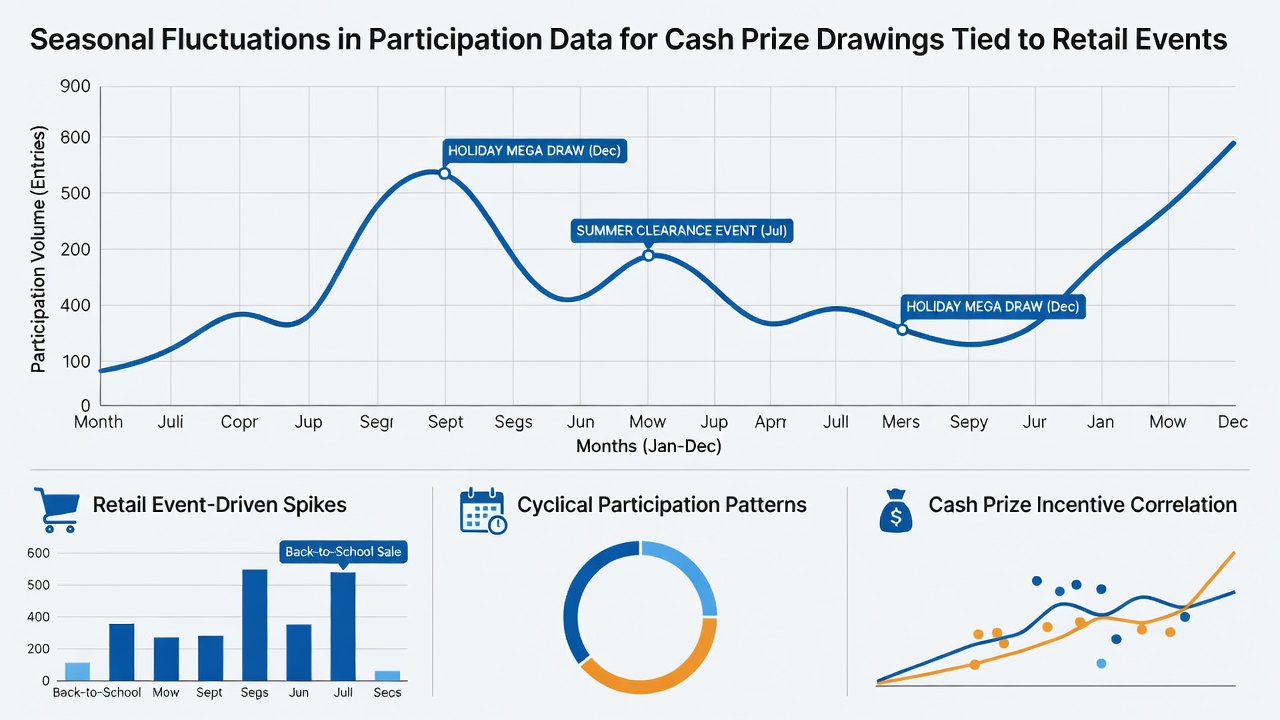
European retail calendars produce parallel movements. Data compiled by the European Commission on consumer promotions indicates that entries climb when major chains run end-of-season clearances in January and July, yet the absolute numbers stay smaller than North American holiday peaks because fewer drawings offer cash alongside product discounts. Australian figures collected by the Australian Competition and Consumer Commission demonstrate a similar pattern around Boxing Day sales, where receipt-based drawings receive elevated submissions for roughly ten days before returning to baseline levels.
Demographic and Geographic Influences
Participation records broken down by region show urban centers maintaining steadier entry rates year-round compared with suburban and rural locations. Shoppers in dense retail corridors encounter more visible point-of-sale signage for drawings, which correlates with higher submission rates during any given promotional window. Age-group analysis reveals that adults between 25 and 44 submit the majority of entries during back-to-school periods, whereas older cohorts increase activity around holiday and post-holiday events.
Weather events occasionally overlay these seasonal baselines. Prolonged winter storms in northern states reduce store visits and therefore drawing entries, while extended periods of mild weather in shoulder seasons extend shopping activity and lift participation above typical monthly averages. Retailers adjust drawing deadlines accordingly, and the resulting data sets capture these external variables without altering the underlying seasonal rhythm.
Measurement Methods and Reporting Standards
Organizations that publish participation statistics rely on standardized receipt-validation systems and digital entry platforms to reduce duplicate counting. Academic studies from institutions such as the University of Toronto's Consumer Behavior Lab confirm that verified entries provide more reliable seasonal comparisons than unfiltered website traffic. These studies also note that promotional rules requiring minimum purchase amounts create measurable thresholds below which entry rates fall, regardless of the time of year.
Cross-border comparisons remain limited because regulatory frameworks differ, yet available reports suggest the same directional movements appear wherever retail events coincide with cash prize incentives. Observers tracking June 2026 activity continue to document these patterns, adding the newest quarter to existing multi-year series without evidence of structural change in seasonal behavior.
Conclusion
Seasonal fluctuations in cash prize drawing participation remain anchored to retail calendars, with the strongest increases occurring during high-traffic shopping windows and the clearest declines appearing in periods of reduced consumer movement. Data collected through mid-2026 continues to illustrate these recurring cycles across multiple countries and retail formats, providing a factual baseline for anyone examining how promotional timing influences entry behavior.